You can't move fast if you can't see your own firm.
The work you don't win, the moves you make too late, the questions you can't answer on the spot. They all come from the same place: no live picture of who's where and what it means.
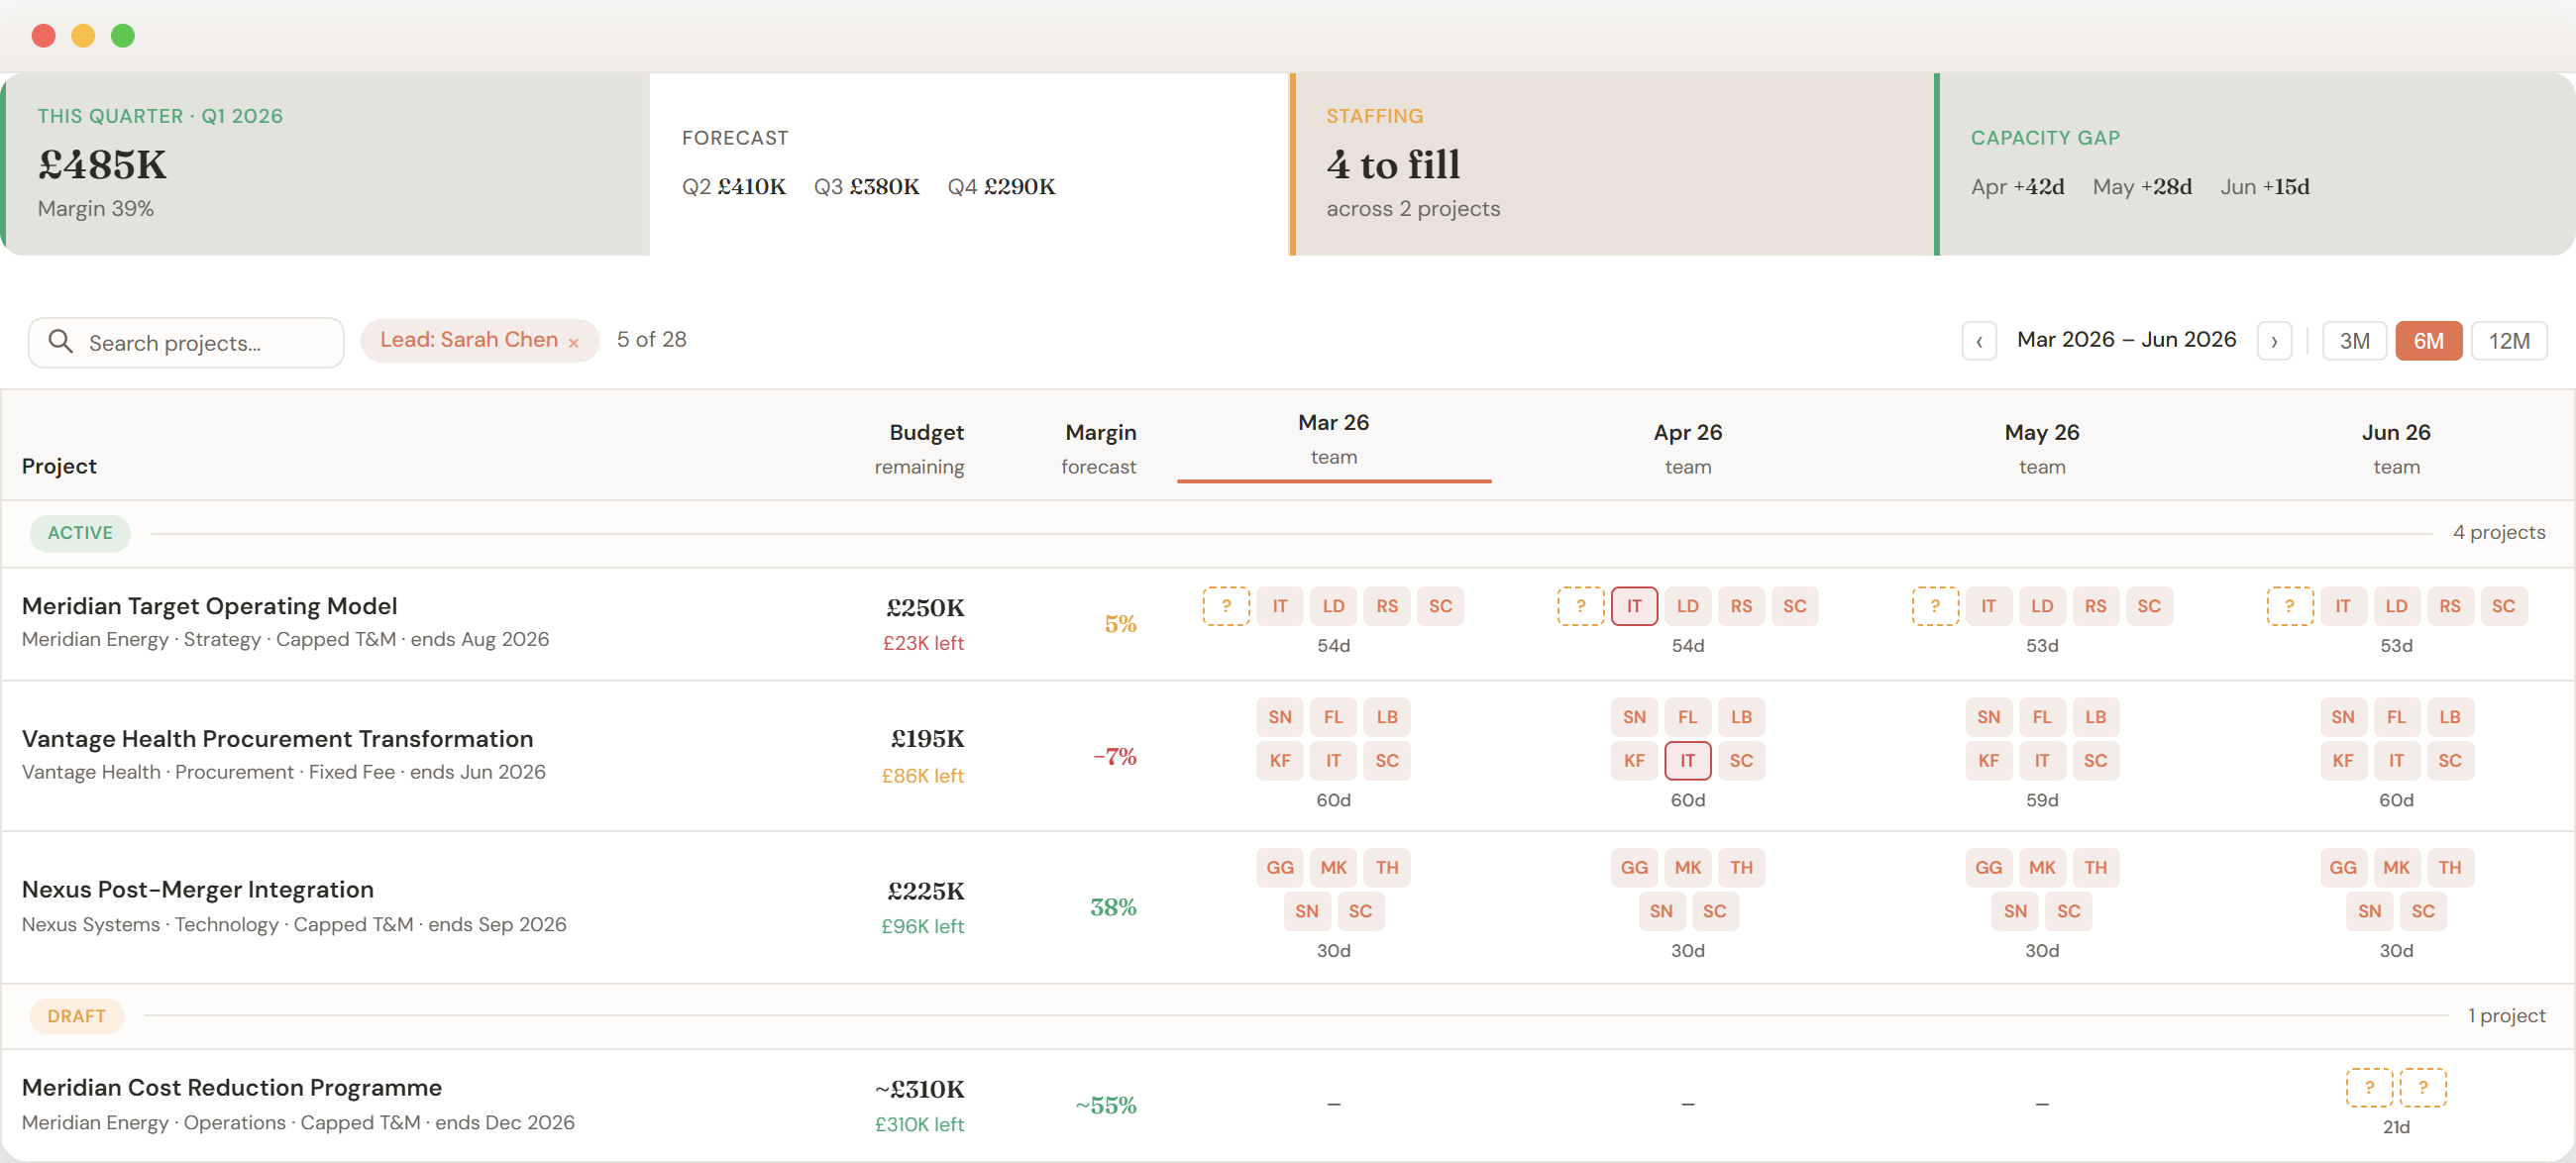
Book a Demo| Project | Budgetremaining | Marginforecast | Mar 26 team | Apr 26team | May 26team | Jun 26team |
|---|---|---|---|---|---|---|
|
Active
4 projects
|
||||||
|
Meridian Target Operating Model
|
£250K £23K left | 5% |
?
IT
LD
RS
SC
54d
|
?
IT
LD
RS
SC
54d
|
?
IT
LD
RS
SC
53d
|
?
IT
LD
RS
SC
53d
|
|
Vantage Health Procurement Transformation
|
£195K £86K left | −7% |
SN
FL
LB
KF
IT
SC
60d
|
SN
FL
LB
KF
IT
SC
60d
|
SN
FL
LB
KF
IT
SC
59d
|
SN
FL
LB
KF
IT
SC
60d
|
|
Nexus Post-Merger Integration
|
£225K £96K left | 38% |
GG
MK
TH
SN
SC
30d
|
GG
MK
TH
SN
SC
30d
|
GG
MK
TH
SN
SC
30d
|
GG
MK
TH
SN
SC
30d
|
|
Draft
1 project
|
||||||
|
Meridian Cost Reduction Programme
|
~£310K £310K left | ~55% | – | – | – |
?
?
21d
|
Start from the plan, not the timesheet.
The plan and the actuals usually live in different places. Pland connects them. The forecast drives the picture, timesheets validate it. You see the commercial impact of a staffing decision before it happens, not after someone logs it.
Running in a day, not a quarter.
No migration project. No implementation consultant. Configure your grades, bulk upload your team and projects, and start making staffing decisions. Most firms are live in hours.
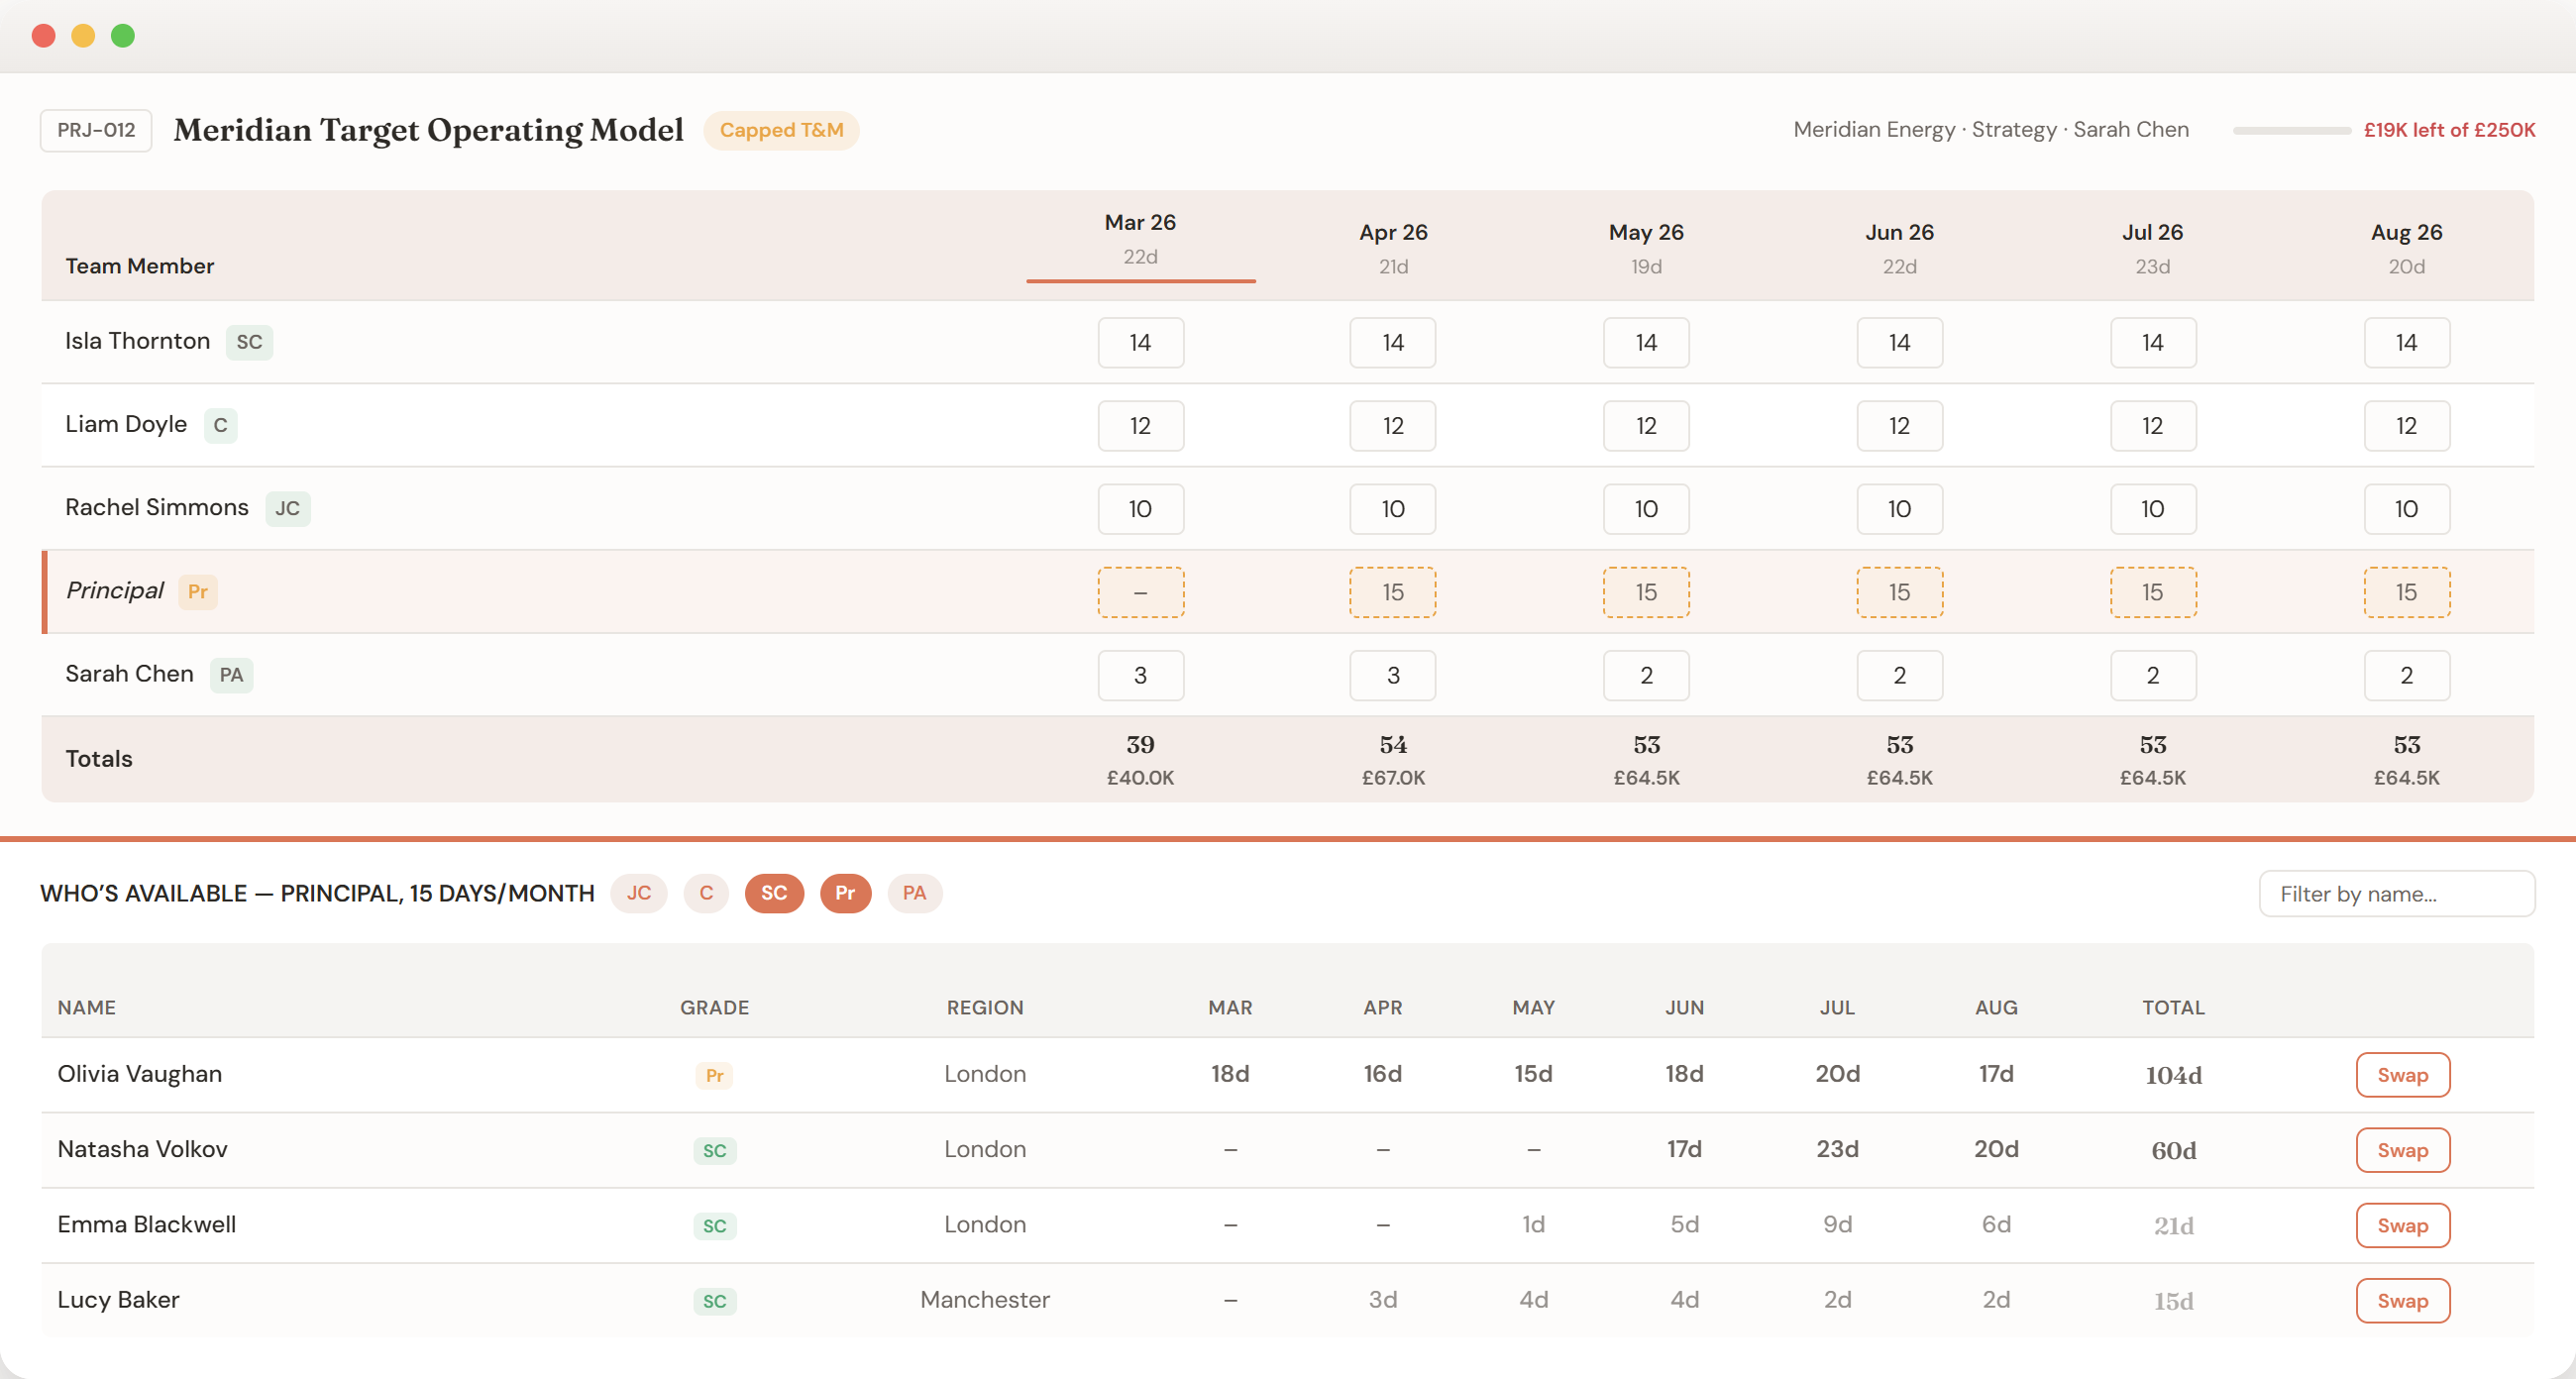
A new project lands. Who's free, and who fits?
The project needs a Principal from May. Pland shows you who can fill it, ranked by capacity, filtered by grade. Someone hands in their notice? See every project they're on, the impact, and who can replace them.
See the person detail| Team Member | Mar 2622d | Apr 2621d | May 2619d | Jun 2622d | Jul 2623d | Aug 2620d |
|---|---|---|---|---|---|---|
|
Isla Thornton
SC
|
||||||
|
Liam Doyle
C
|
||||||
|
Rachel Simmons
JC
|
||||||
|
Principal
Pr
|
||||||
|
Sarah Chen
PA
|
||||||
| Totals | 39 £40.0K |
54 £67.0K |
53 £64.5K |
53 £64.5K |
53 £64.5K |
53 £64.5K |
| Name | Grade | Region | Mar | Apr | May | Jun | Jul | Aug | Total | |
|---|---|---|---|---|---|---|---|---|---|---|
| Olivia Vaughan | Pr | London | 18d | 16d | 15d | 18d | 20d | 17d | 104d | |
| Natasha Volkov | SC | London | – | – | – | 17d | 23d | 20d | 60d | |
| Emma Blackwell | SC | London | – | – | 1d | 5d | 9d | 6d | 21d | |
| Lucy Baker | SC | Manchester | – | 3d | 4d | 4d | 2d | 2d | 15d |
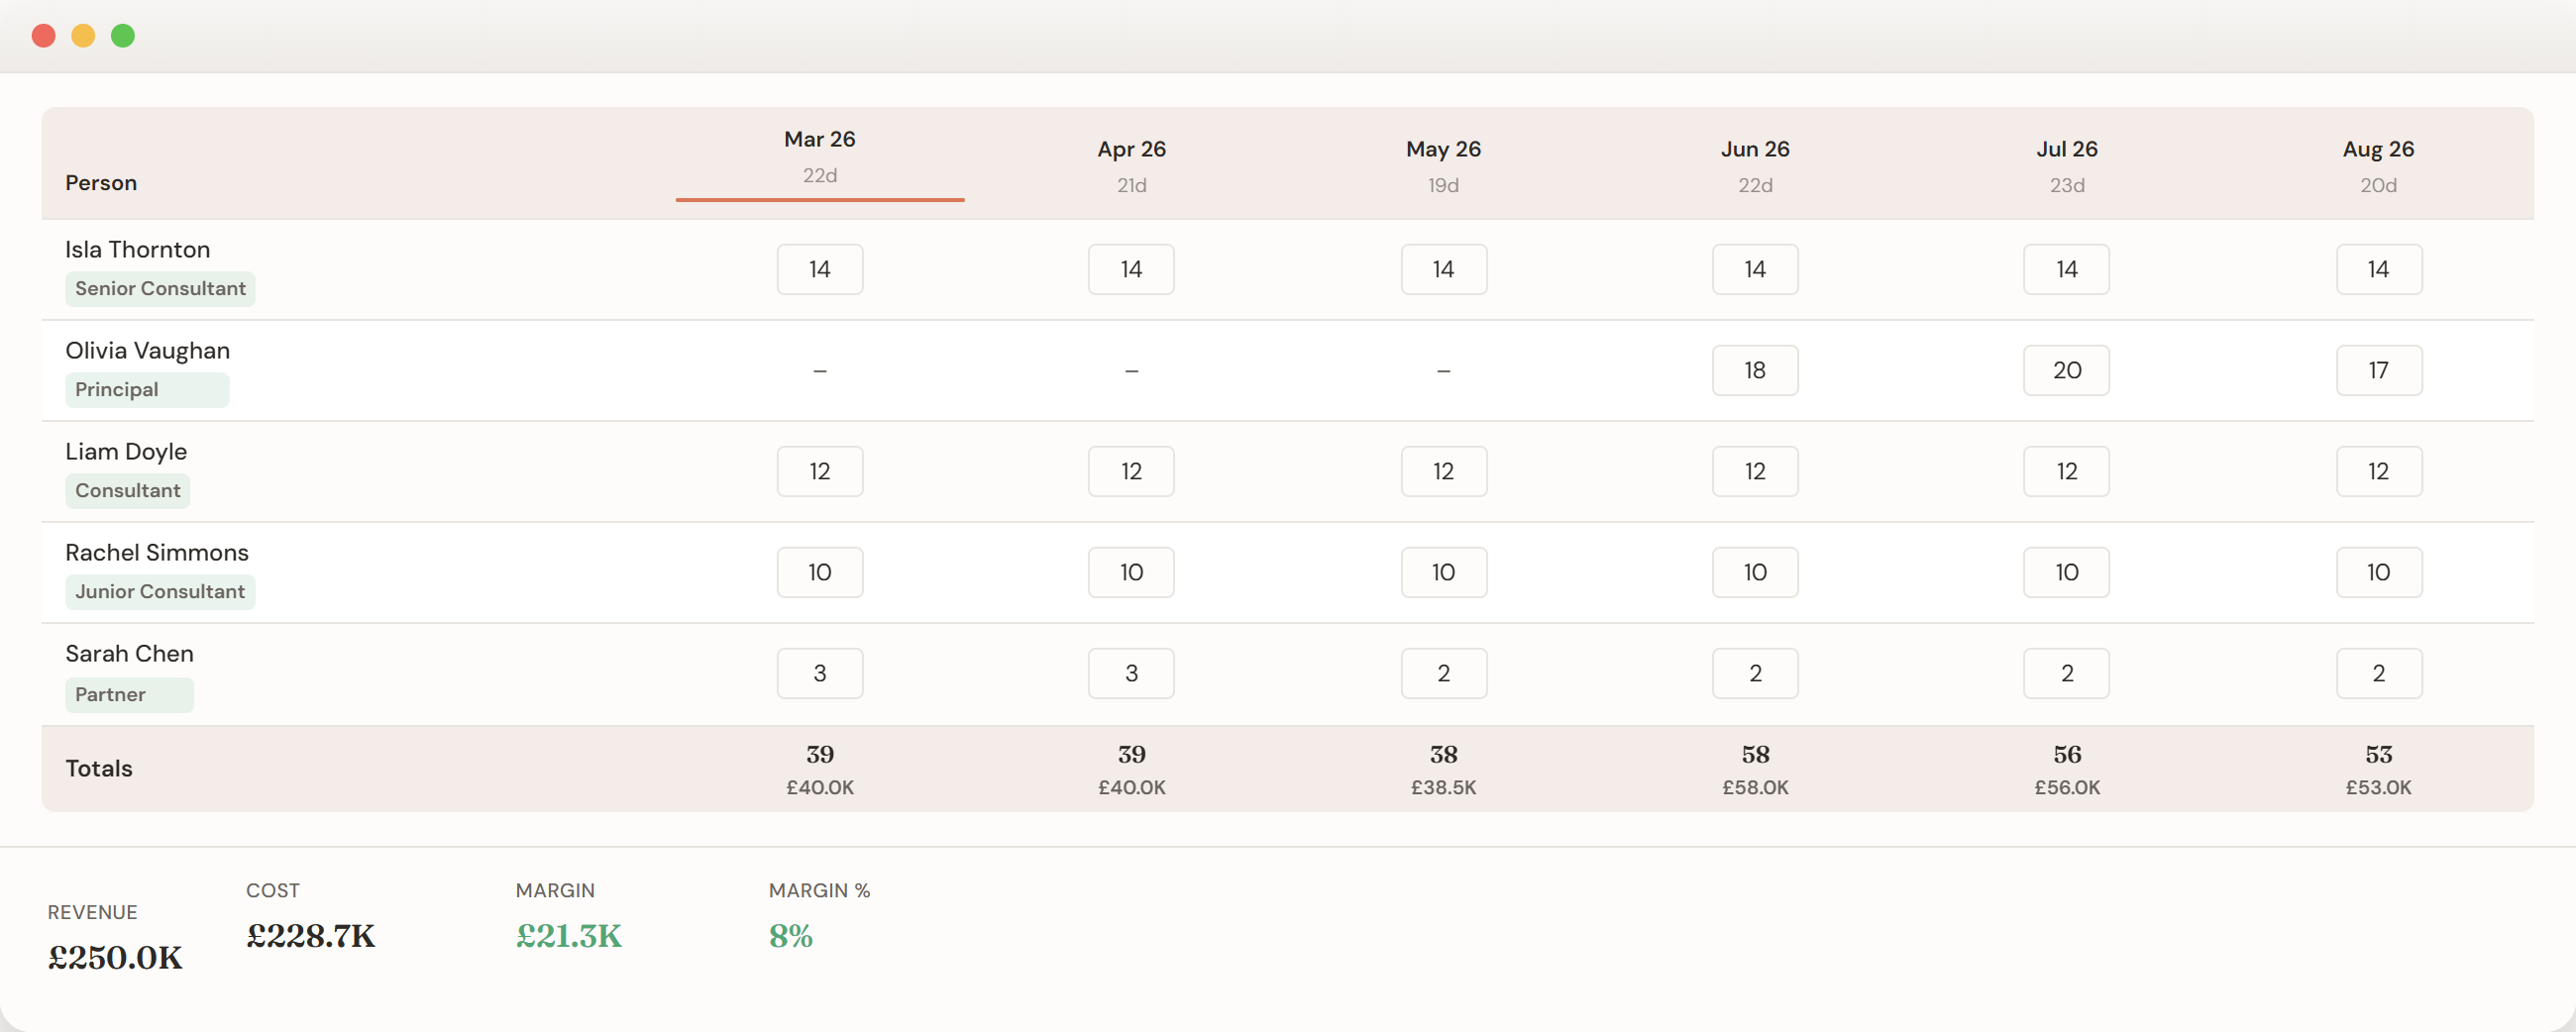
You assign them. The margin moves.
Most tools start from the timesheet and work backwards. Pland starts from the plan. Add someone to a project. As you edit the days, the forecast P&L updates: revenue, cost, margin. No saving, no waiting, no separate report. The commercial impact is right there in the staffing decision.
See project staffing| Person | Mar 2622d | Apr 2621d | May 2619d | Jun 2622d | Jul 2623d | Aug 2620d |
|---|---|---|---|---|---|---|
|
Isla Thornton
Senior Consultant
|
||||||
|
Olivia Vaughan
Principal
|
||||||
|
Liam Doyle
Consultant
|
||||||
|
Rachel Simmons
Junior Consultant
|
||||||
|
Sarah Chen
Partner
|
||||||
| Totals | 39 £40.0K |
54 £55.5K |
53 £54.0K |
53 £54.0K |
53 £54.0K |
53 £54.0K |
Every project and every person, on the same screen.
One view shows which projects are healthy and which are quietly bleeding. Switch to see who's stretched across too many, who's on the bench, and where the capacity gaps are. Same data, different angle. No separate reports, no Friday afternoon rebuild.
See the portfolio view| Project | Budgetremaining | Marginforecast | Mar 26 team | Apr 26team | May 26team | Jun 26team |
|---|---|---|---|---|---|---|
|
Active
4 projects
|
||||||
|
Meridian Target Operating Model
|
£250K £23K left | 5% |
?
IT
LD
RS
SC
54d
|
?
IT
LD
RS
SC
54d
|
?
IT
LD
RS
SC
53d
|
?
IT
LD
RS
SC
53d
|
|
Vantage Health Procurement Transformation
|
£195K £86K left | −7% |
SN
FL
LB
KF
IT
SC
60d
|
SN
FL
LB
KF
IT
SC
60d
|
SN
FL
LB
KF
IT
SC
59d
|
SN
FL
LB
KF
IT
SC
60d
|
|
Nexus Post-Merger Integration
|
£225K £96K left | 38% |
GG
MK
TH
SN
SC
30d
|
GG
MK
TH
SN
SC
30d
|
GG
MK
TH
SN
SC
30d
|
GG
MK
TH
SN
SC
30d
|
|
Draft
1 project
|
||||||
|
Meridian Cost Reduction Programme
|
~£310K £310K left | ~55% | – | – | – |
?
?
21d
|
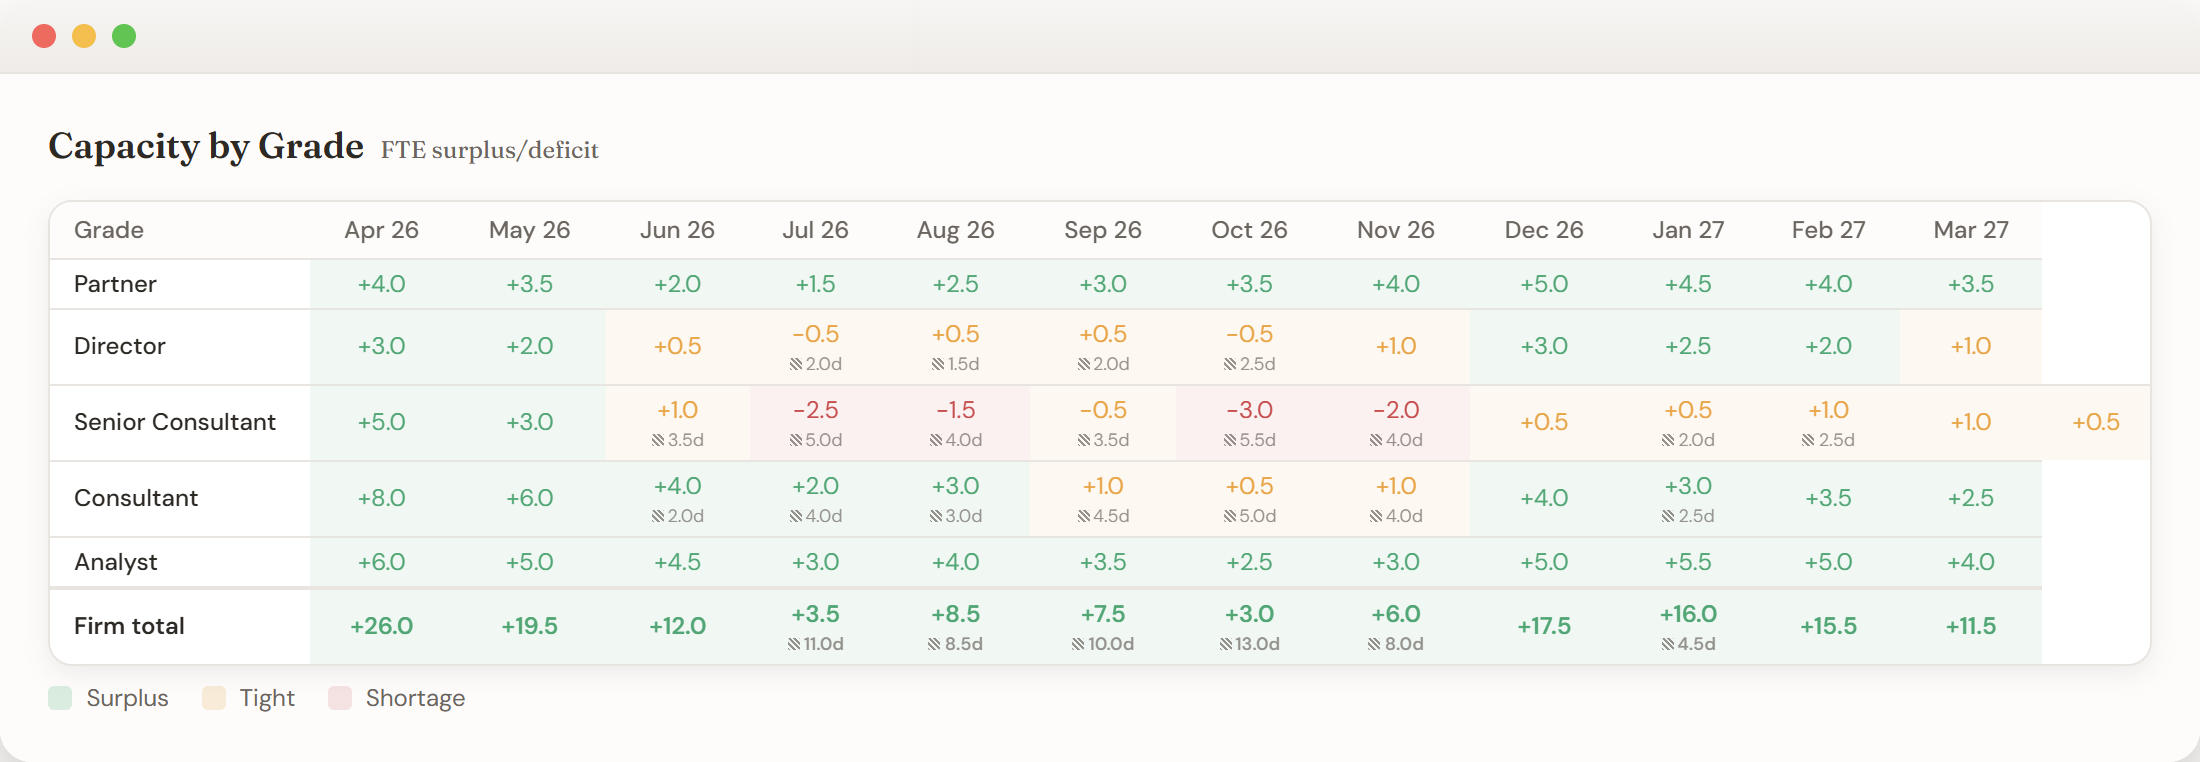
What's coming, and can you staff it?
Every Friday, someone rebuilds the utilisation picture from scratch. With Pland, that view is just there. Utilisation, bench, pipeline demand, capacity gap. Live, not reconstructed. Draft projects building up, bench rising, you can see the gap between what's coming and who's available. Hiring decisions come from data, not gut feel.
See the team overview| Grade | Apr 26 | May 26 | Jun 26 | Jul 26 | Aug 26 | Sep 26 | Oct 26 | Nov 26 | Dec 26 | Jan 27 | Feb 27 | Mar 27 |
|---|---|---|---|---|---|---|---|---|---|---|---|---|
| Partner | +4.0 | +3.5 | +2.0 | +1.5 | +2.5 | +3.0 | +3.5 | +4.0 | +5.0 | +4.5 | +4.0 | +3.5 |
| Director | +3.0 | +2.0 | +0.5 | -0.5 2.0d |
+0.5 1.5d |
+0.5 2.0d |
-0.5 2.5d |
+1.0 | +3.0 | +2.5 | +2.0 | +1.0 |
| Senior Consultant | +5.0 | +3.0 | +1.0 3.5d |
-2.5 5.0d |
-1.5 4.0d |
-0.5 3.5d |
-3.0 5.5d |
-2.0 4.0d |
+0.5 | +0.5 2.0d |
+1.0 2.5d |
+0.5 |
| Consultant | +8.0 | +6.0 | +4.0 2.0d |
+2.0 4.0d |
+3.0 3.0d |
+1.0 4.5d |
+0.5 5.0d |
+1.0 4.0d |
+4.0 | +3.0 2.5d |
+3.5 | +2.5 |
| Analyst | +6.0 | +5.0 | +4.5 | +3.0 | +4.0 | +3.5 | +2.5 | +3.0 | +5.0 | +5.5 | +5.0 | +4.0 |
| Firm total | +26.0 | +19.5 | +12.0 | +3.5 11.0d |
+8.5 8.5d |
+7.5 10.0d |
+3.0 13.0d |
+6.0 8.0d |
+17.5 | +16.0 4.5d |
+15.5 | +11.5 |
Built because we spent hours piecing together a picture that should have already been there.
Tracing knock-on effects across projects, chasing availability, reconciling spreadsheets that never agreed. The job always fell back to manual work.
Built for firms stuck between scheduling tools that don't show the commercial picture and platforms that want to run your entire operation.
“I stopped chasing people for availability updates. Everyone's looking at the same picture.”
“We lost a bid because we couldn't confirm availability in time. That was the last time.”
“Nobody argues about whose numbers are right anymore. There's one version.”
Scheduling solves half the problem.
Scheduling tools
- Who's working where
- What's booked this month
- Whether someone's double-allocated
PL&
- What that staffing costs you
- What happens to the margin if you move someone
- Who's free at the right grade, and the impact if you assign them
- Which projects are healthy and which are quietly bleeding
- What your capacity looks like three months from now
See it for yourself.
We'll walk through it with your kind of firm in mind. No slides, no fluff. 25 minutes.
You'll see how it fits before you commit.
Book a 25-Minute DemoWe'll be in touch.
We've got your details. Expect to hear from us within one business day.